WHO’s larger air-quality database came with firm limits on city comparisons
Retrospective: the June 2026 edition assembled historical measurements; monitoring gaps and modeling matter to interpreting health exposure.
- Event / announcement date
- 2026-06-30
- Earliest linked source date
- 2026-06-29
- NewsTumble first published
- 2026-10-26T20:52:39Z
- NewsTumble updated
- 2026-10-26T20:52:39Z
WHO released its eighth ambient-air-quality database edition on June 30, 2026. Its database page reports observations from 8,023 settlements across 127 WHO member states, associate members and territories or areas, covering 2010–2024. A newly published edition can therefore contain older measurements; it is not a live air-quality feed. [1] [2]
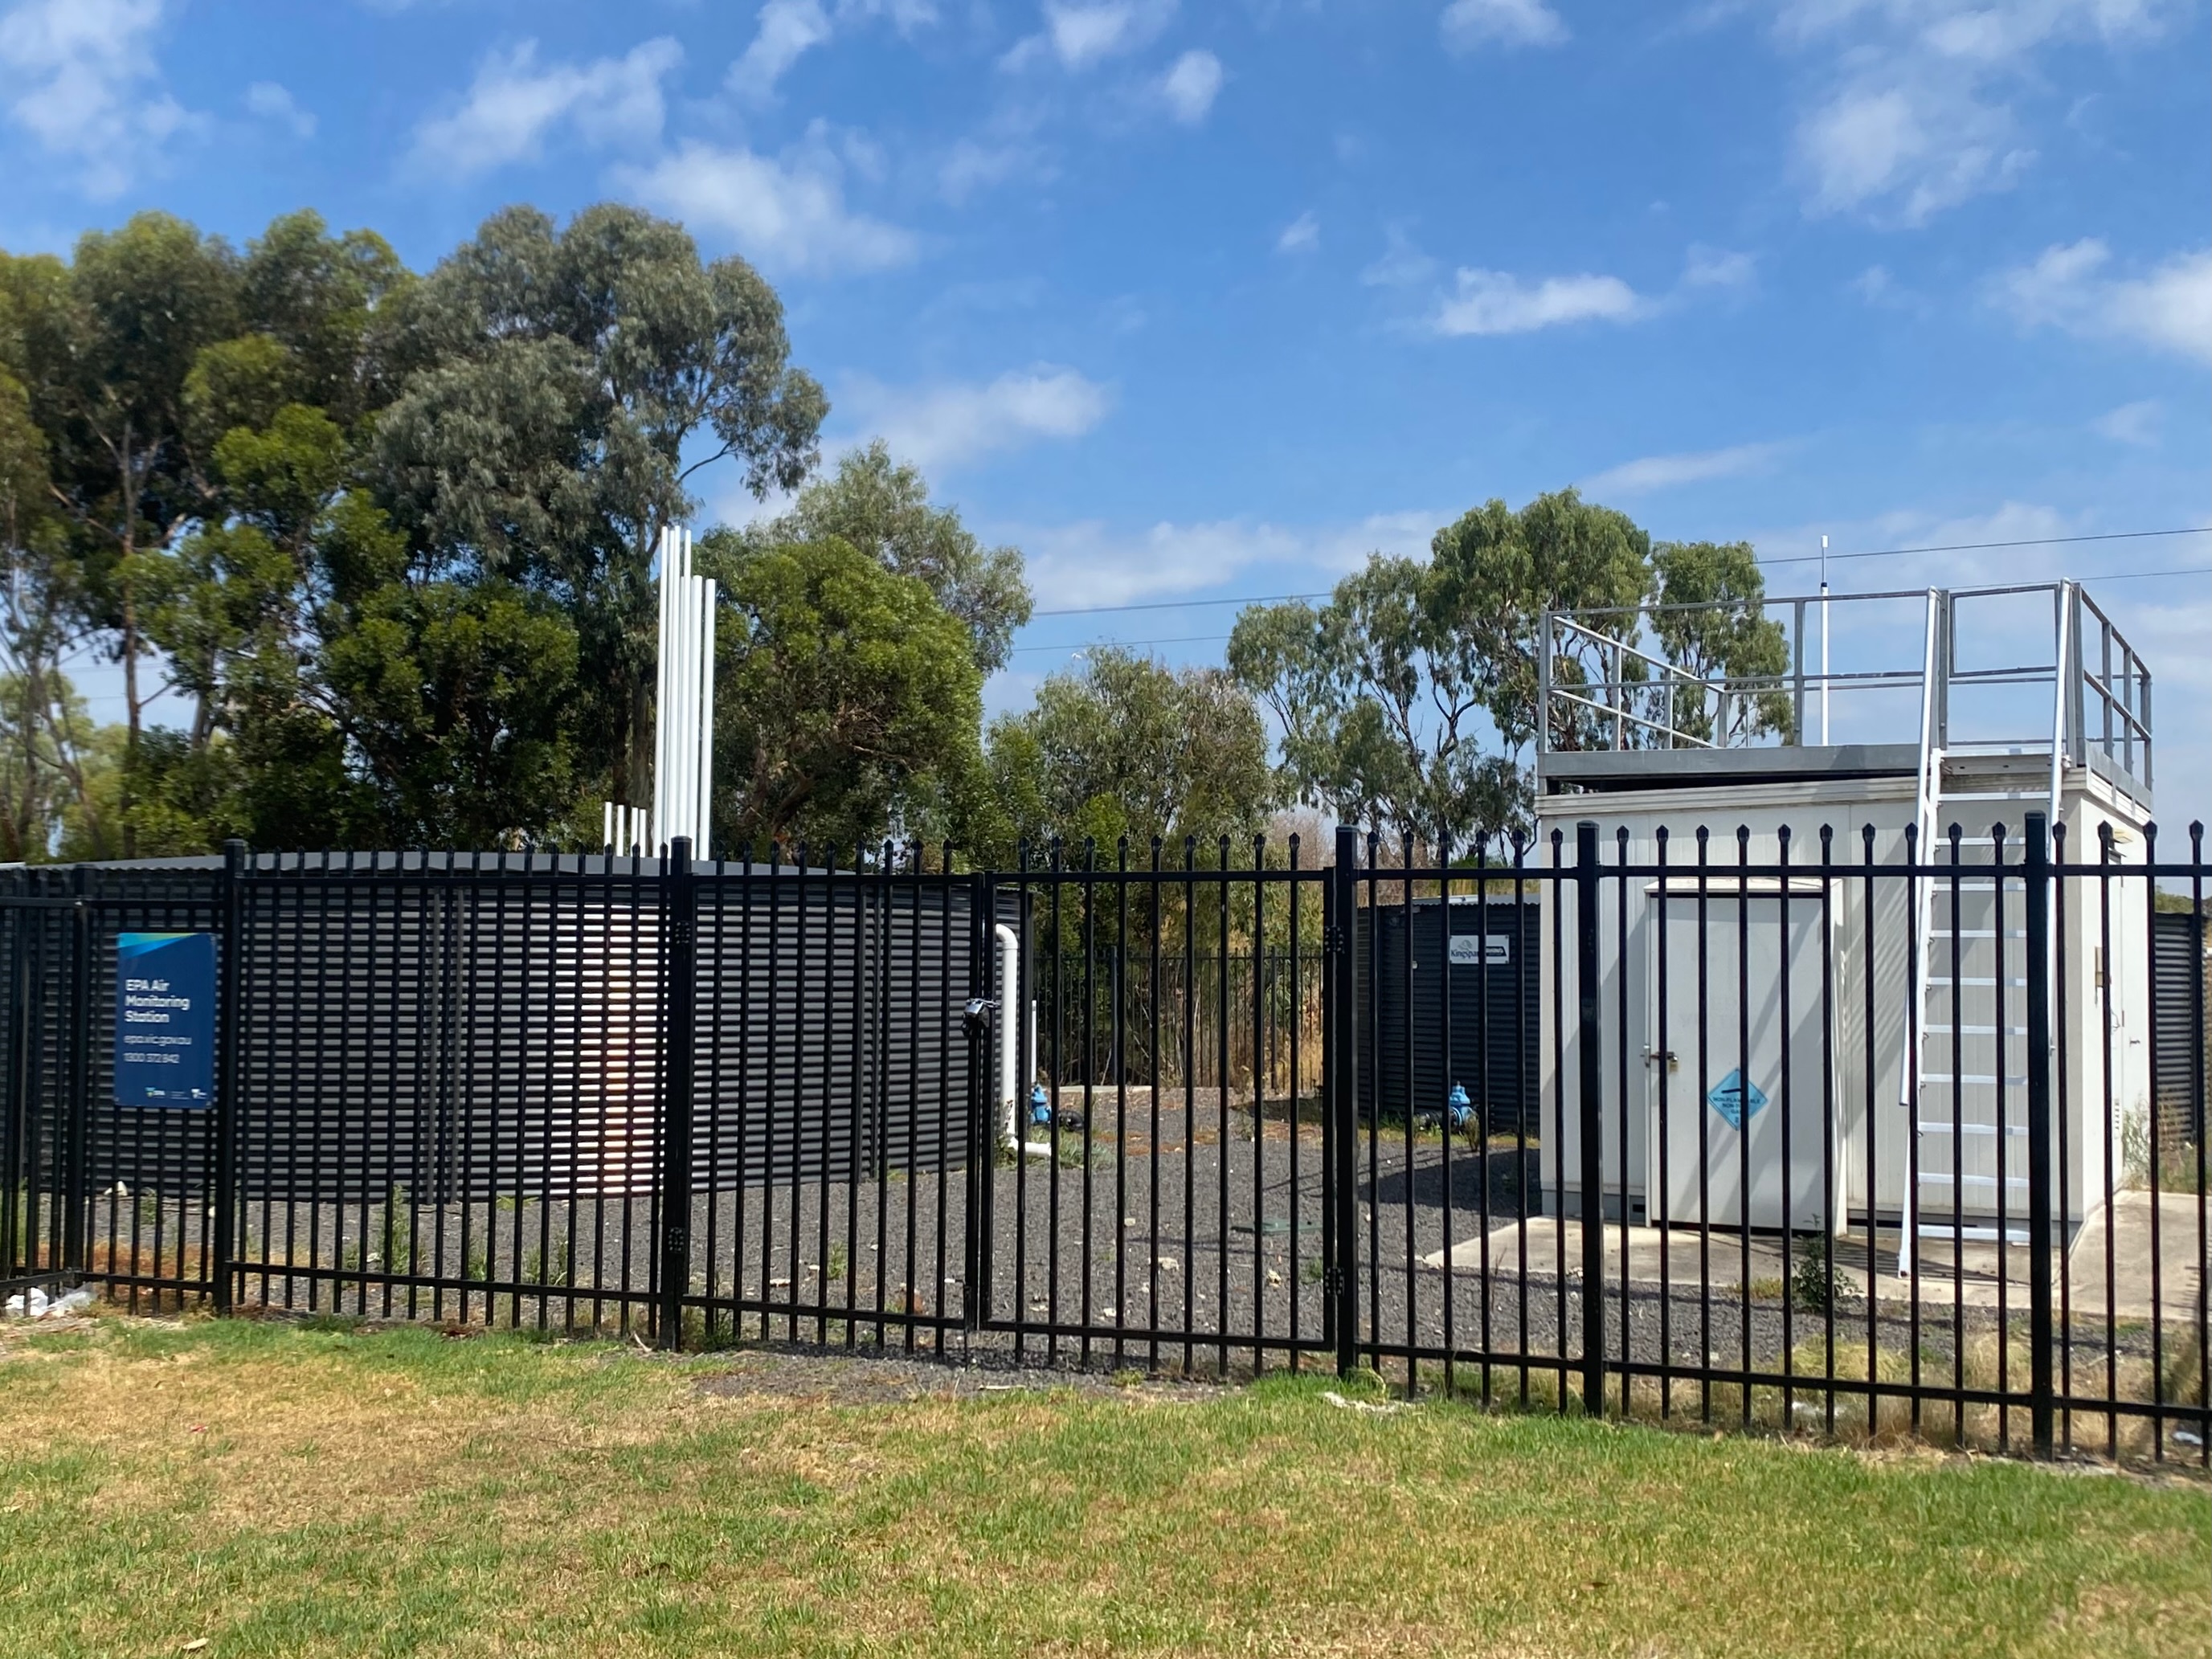
The technical release describes annual mean concentrations of nitrogen dioxide and two sizes of particulate matter, PM10 and PM2.5. They aim to represent a city or town average rather than an individual station. That scale is useful for population assessment but cannot establish the pollution beside a particular home on a particular day. [1]
WHO explicitly says the database should not rank the most polluted cities or support direct country comparisons. Monitoring coverage, methods and documentation differ. Some places have only limited coverage, and measurements from part of a year may not represent a full annual average. A larger spreadsheet does not remove those limitations. [2]
A separate June 29 WHO update explains the bridge from measurements to health indicators. Its city-air indicator combines satellite observations and atmospheric models, recalibrated with national monitoring and population data. Health-burden estimation then links exposure proxies with epidemiological evidence. WHO also reports higher exposures in lower-income settings; those inequalities are not visible simply by counting the places with monitors. [3]
The release sits within a compilation program updated every two or three years since 2011. Its stated inputs include official country reports, national and subnational datasets and government websites. That history makes the edition a tool for assembling evidence across different systems, rather than a single standardized field survey carried out everywhere at once. [1]
For residents and community researchers, the useful questions are which year a measurement represents, how much of that year was observed and whether a local monitoring network supports the average. Missing observations do not establish clean air. This retrospective did not audit individual stations, reconstruct personal exposures or verify that later policies reduced pollution. [2]
The source
- World Health Organization: Eighth air-quality edition release ↗
Source published 2026-06-30 · reviewed October 26, 2026 - World Health Organization: Air-quality database scope and limits ↗
Source published 2026-06-30 · reviewed October 26, 2026 · Edition 8 release is explicitly dated June 30, 2026; this is not the measurement period. - World Health Organization: Air-pollution indicator methods update ↗
Source published 2026-06-29 · reviewed October 26, 2026
About this item: Retrospective report. No first-hand reporting or independent testing is claimed. Corrections policy.