Reading a deep-Gulf decline
A post-spill baseline needs care.
- Event / announcement date
- 2026-10-21
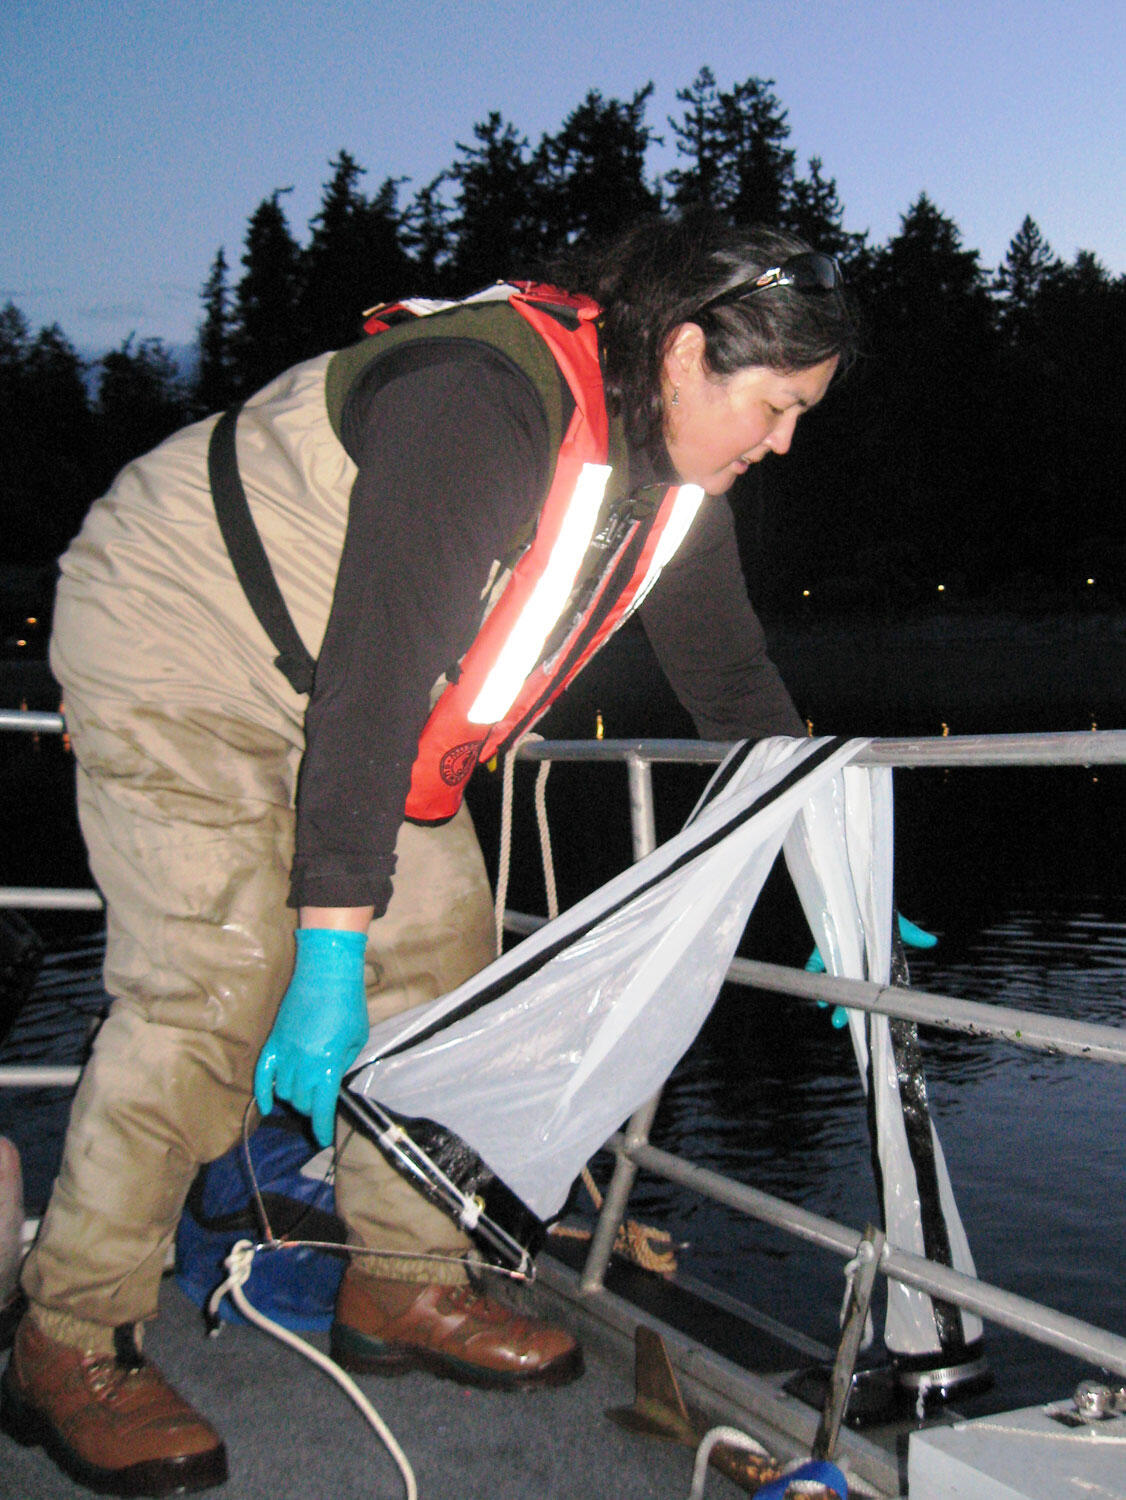
NOAA’s October 21 account reports 63.5% fewer fish in deep-Gulf net samples from 2015–2023 than in the 2011 benchmark. Sampling reached 1,500 meters; small fish and invertebrates feed larger predators. Crucially, that benchmark followed the 2010 oil spill. The researchers favor a spill explanation, but the account explicitly says the declines cannot be tied directly to it. This is evidence about sampled prey communities, rather than a census of all Gulf life. [1]
The method has a history beyond this survey. NOAA’s January 2002 MOCNESS instructions describe sending depth, temperature, conductivity and flow data back to the ship while a pilot directs sampling. Such records help place a catch in its water-column setting. Those Alaska and Bering Sea instructions describe a different configuration; they do not establish the Gulf study’s sampling coverage. [2]
NOAA’s restoration history explains why that distinction matters for public accountability. The 2016 damage assessment adopted restoration across the ecosystem, while subsequent monitoring helps target work and evaluate recovery. A new abundance series can reveal a continuing problem without, by itself, proving which restoration project succeeded or failed. [3]
The source
- NOAA Fisheries: Deep-Gulf nekton study ↗
Source date 2026-10-21 · reviewed October 29, 2026 - NOAA PMEL: MOCNESS operating instructions ↗
Undated reference · reviewed October 29, 2026 · Exact publication date is not given; instructions say January 2002. - NOAA Fisheries: Deepwater Horizon restoration ↗
Undated reference · reviewed October 29, 2026 · No publication date is given on this reference. The actual footer says updated October 29, 2026; that is not treated as original publication.
About this item: News report. No first-hand reporting or independent testing is claimed. Corrections policy.