Satellite study maps ocean nutrient stress
Retrospective: a study connected satellite patterns with biological evidence.
- Event / announcement date
- 2026-06-05
- Earliest linked source date
- 2026-06-05
- NewsTumble first published
- 2026-10-27T02:28:02Z
- NewsTumble updated
- 2026-10-27T02:28:02Z
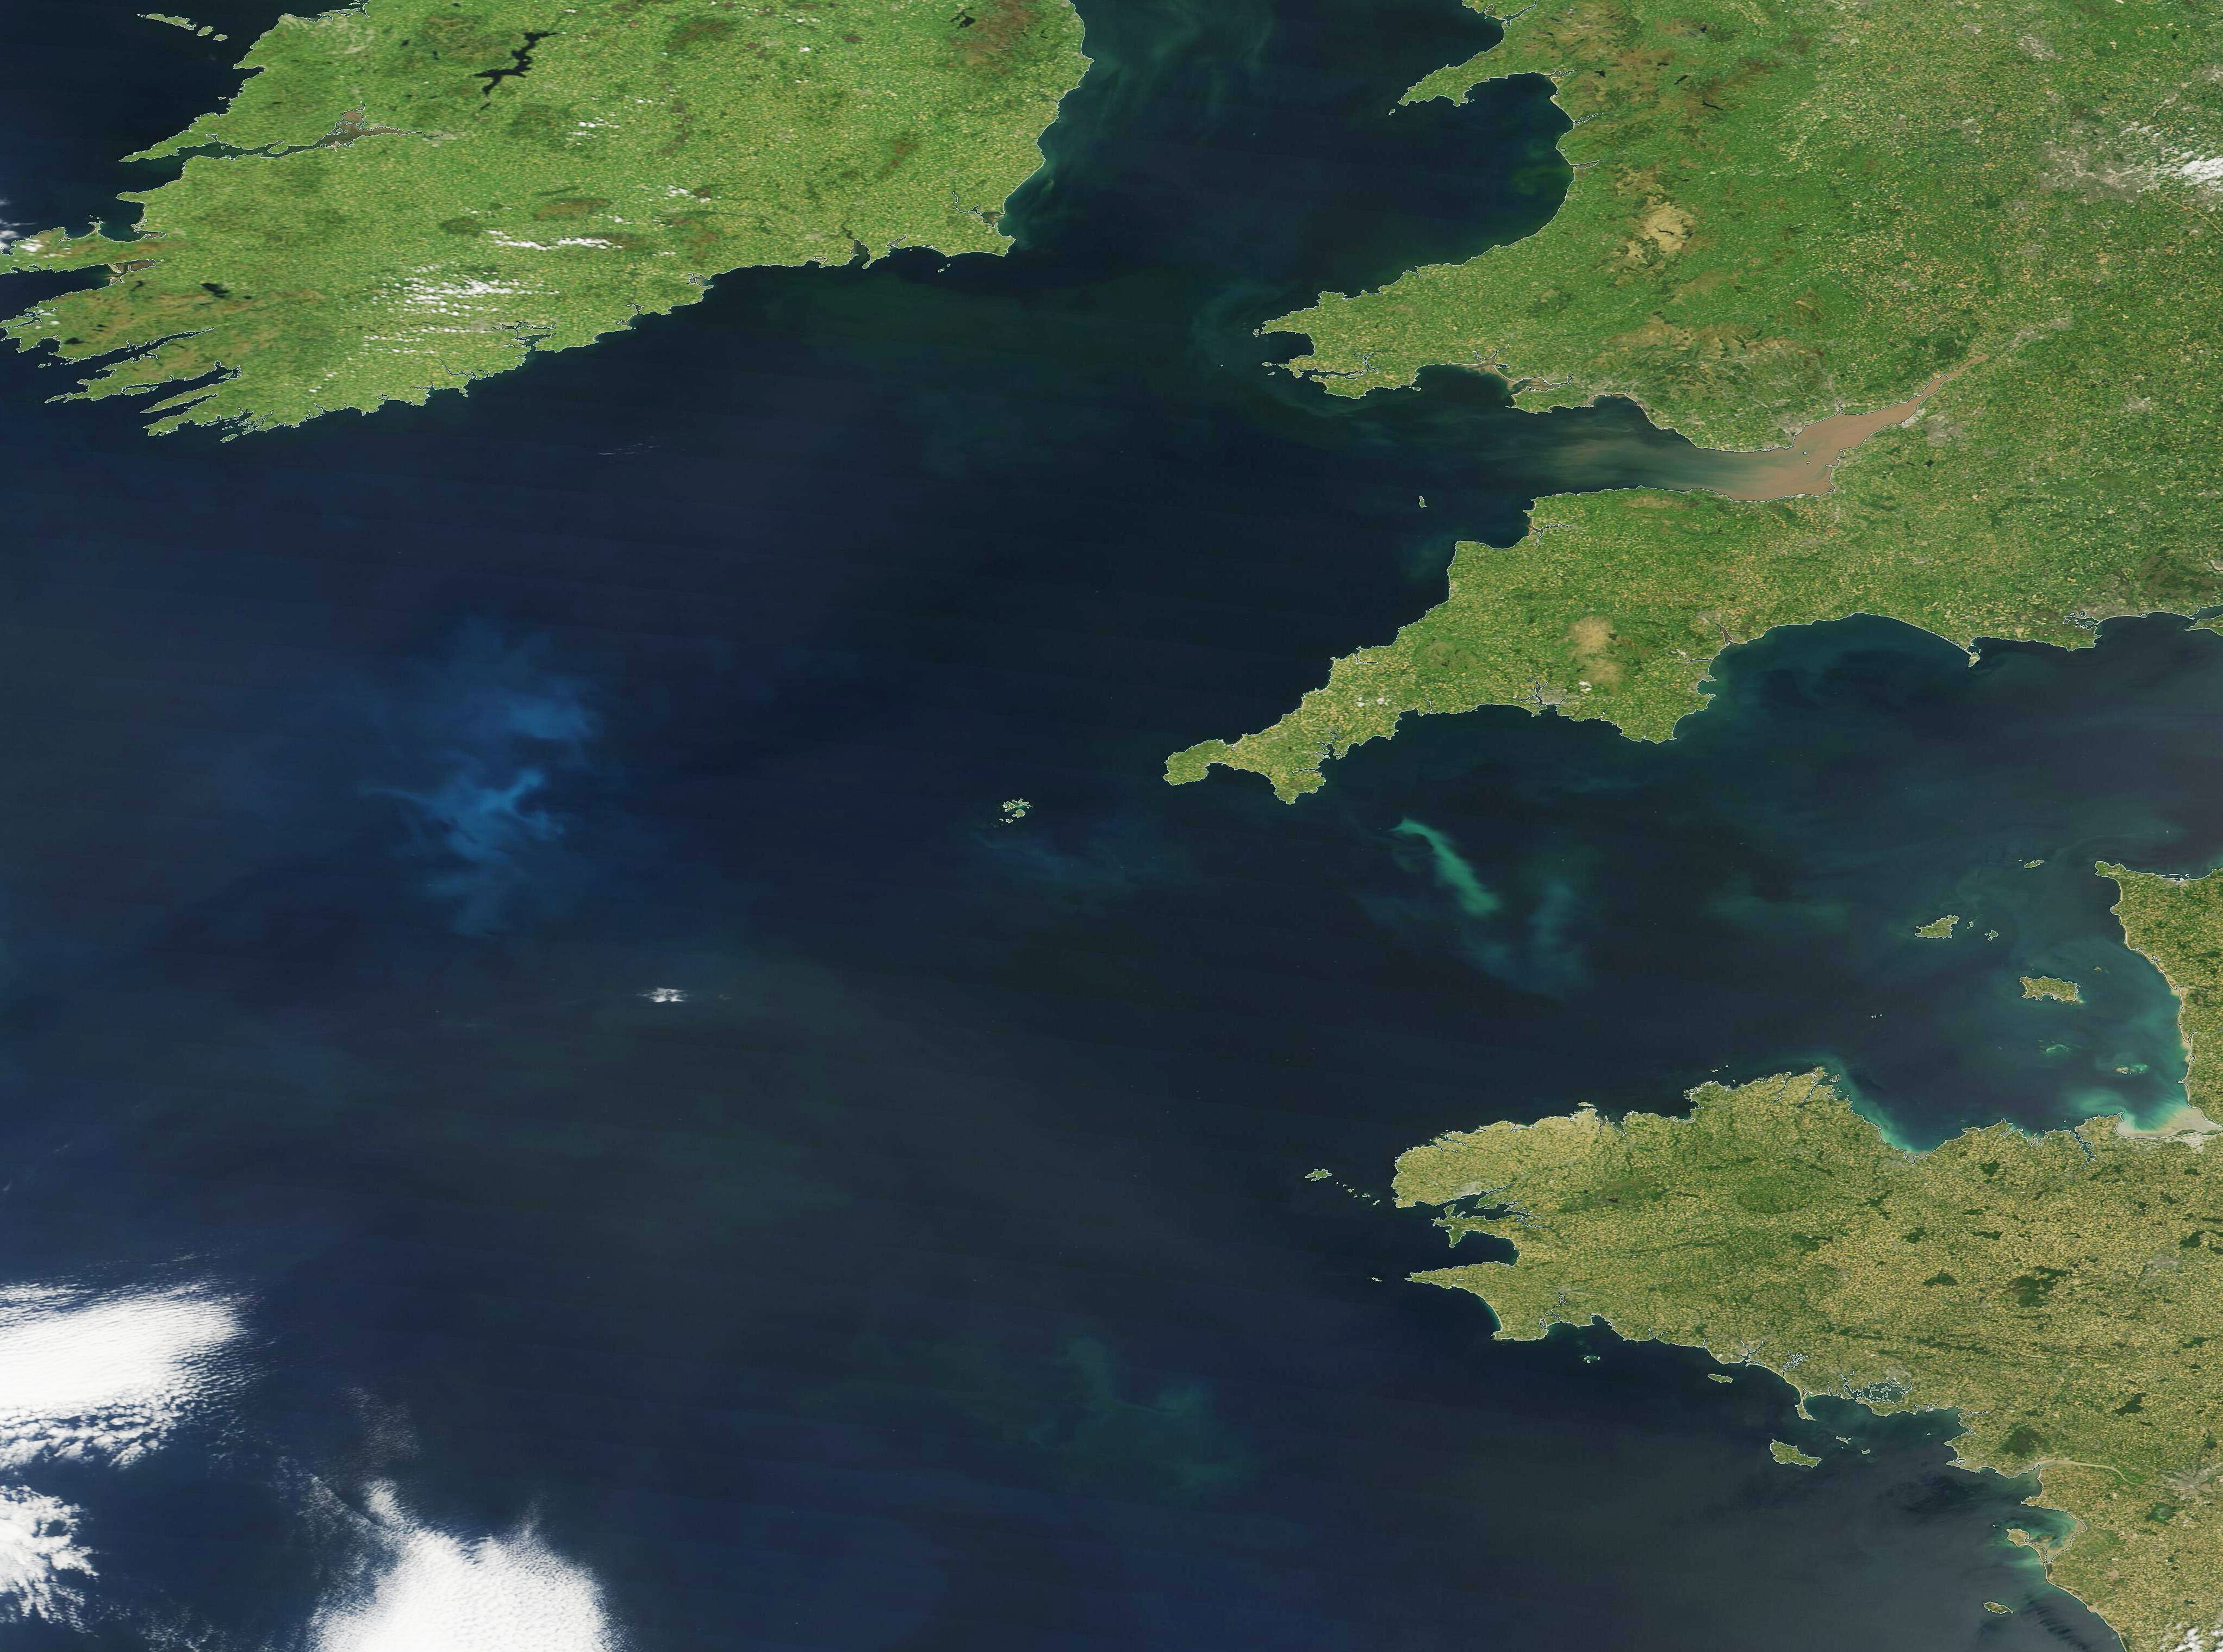
A June 5, 2026 Science Advances study combined satellite physiology estimates with genomic, hydrographic and experimental observations to examine phytoplankton nutrient stress. Its satellite record covered 2002–2021, between 40° north and 40° south. The index adjusts carbon-to-chlorophyll ratios for light conditions; it infers physiological stress rather than directly measuring a nutrient concentration. [1]
NASA’s account explains one mechanism: a warm surface layer can inhibit mixing with deeper, nutrient-rich water. But the response varied by region and nutrient. Some southern nutrient-poor waters showed less stress than expected, possibly because nitrogen-fixing microbes partly compensated. That proposed explanation should not be read as a universal response or proof of future ecosystem resilience. [2]
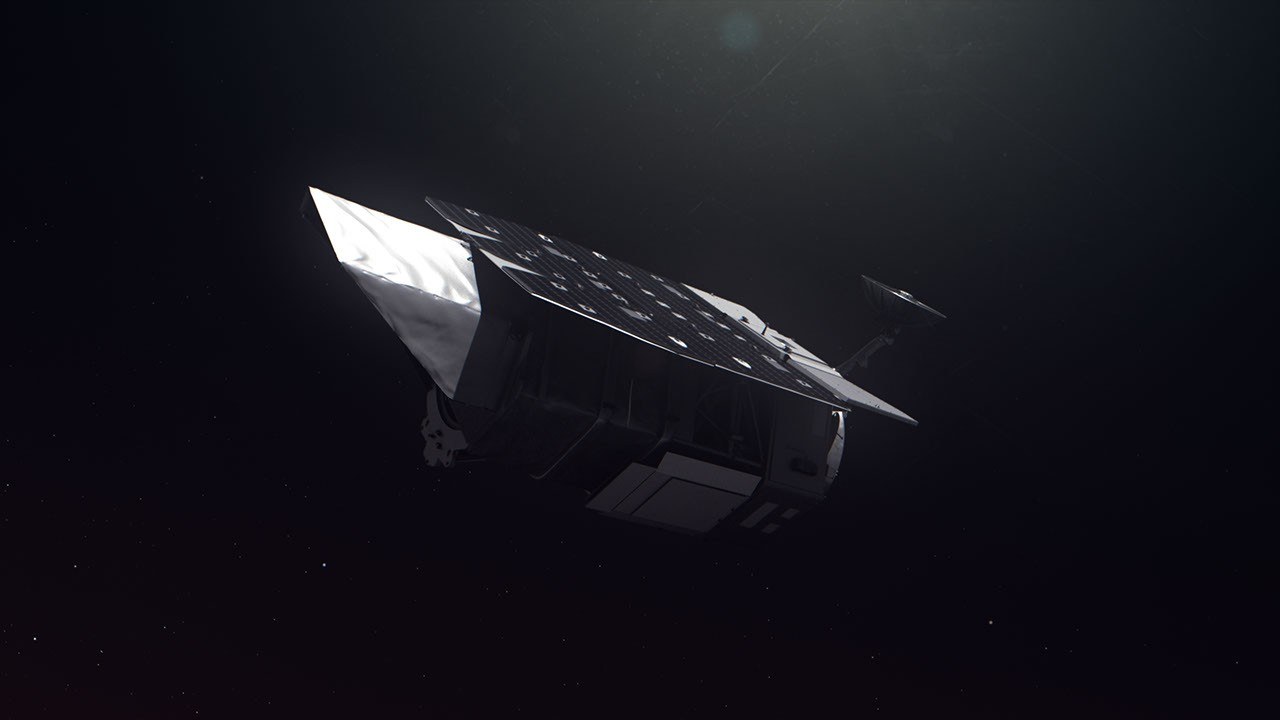
The measurement history matters. NASA’s MODIS reference describes a 36-band instrument observing visible and infrared radiation, first launched on Terra in 1999 and then Aqua in 2002. Its observations support derived products including ocean chlorophyll. Wide coverage comes through interpretation of recorded light, a different measurement process from collecting water or organisms at sea. [3]
NOAA’s September 23 reference identifies phytoplankton as the base of several food webs, requiring sunlight and nutrients for growth. Excess nutrients can also contribute to harmful blooms. Its account describes research used to inform coastal authorities’ responses. Observing these organisms therefore concerns both the food available to other sea creatures and the management of bloom hazards. [4]
The source
- Science Advances via PubMed Central: Genomic-to-space measurements reveal large-scale ocean nutrient stress ↗
Source published 2026-06-05 · reviewed October 26, 2026 · Published June 5, 2026; DOI metadata agrees. - NASA: NASA Satellites Help Map Ocean Nutrient Stress ↗
Source updated 2026-06-08 · reviewed October 26, 2026 · Article headed June 5; footer updated June 8, 2026. - NASA: MODIS ↗
Source updated 2026-08-20 · reviewed October 26, 2026 · Page updated August 20, 2026. - NOAA: What are phytoplankton? ↗
Source updated 2026-09-23 · reviewed October 26, 2026 · Page updated September 23, 2026.
About this item: Retrospective report. No first-hand reporting or independent testing is claimed. Corrections policy.